Sales Report By Location
Track and compare revenue across stores or regions with our free Sales Report By Location template, available as a free download in PDF and DOCX.
PDF
DOCX
0
likes
Download Files
- DOCX
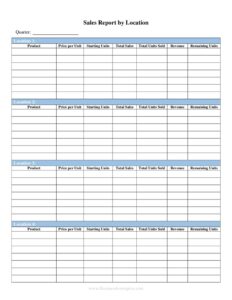
A Sales Report By Location is a structured summary that breaks down revenue, units sold, and performance metrics for each store, branch, region, or sales territory. Businesses use it most often to compare how different locations are performing side by side so they can spot top performers, fix underperformers, and allocate budget wisely. It’s free to download here in both PDF and DOCX, with no signup required.
What Is a Sales Report By Location?
A Sales Report By Location is a reporting document that organizes sales data geographically rather than by product or salesperson alone. It is typically prepared by a sales manager, regional director, store operations lead, or finance analyst, and it documents how much each physical or virtual location generated over a defined period. Instead of looking at a single company-wide number, the report shows the contribution of each site — total sales, transaction counts, average sale value, and comparison against targets or prior periods. The goal is to make geographic performance visible at a glance so leadership can make decisions about staffing, inventory, marketing spend, and expansion based on real, location-level evidence.
When Do You Need a Sales Report By Location?
This report becomes valuable any time a company operates in more than one place or wants to understand where its revenue truly comes from. Common situations include:
- Multi-store retail chains comparing weekly or monthly sales across several storefronts to identify which locations are leading or lagging.
- Regional sales management rolling up territory numbers for a quarterly review with executives or investors.
- Franchise operations tracking performance across franchised units to enforce standards and share best practices.
- Restaurant and hospitality groups measuring per-venue revenue to plan staffing levels and supply orders.
- Expansion planning, where leadership evaluates which markets justify new locations and which should be consolidated or closed.
- Marketing attribution, comparing how promotions or local advertising lifted sales in specific regions versus a control location.
Types of Location-Based Sales Reports
Not every Sales Report By Location looks the same. A store-level report focuses on individual storefronts and is often reviewed daily or weekly. A regional or territory report aggregates multiple sites into zones for higher-level strategy. A period comparison report places this month against last month or this year against last year to reveal trends. Choosing the right granularity keeps the report readable: too much detail overwhelms decision-makers, while too little hides the very problems the report is meant to surface.
What a Sales Report By Location Should Have
A complete location sales report should include enough context for the numbers to mean something. Essential elements are:
- A clear reporting period (date range) and the date the report was prepared.
- The name and identifier of each location, region, or store number.
- Total sales revenue per location, ideally in a consistent currency.
- Units or transactions sold and the average sale value.
- A comparison column — versus target, prior period, or budget — with the variance shown.
- A totals row that sums every location into a company-wide figure.
- Optional notes explaining anomalies such as a closure, a promotion, or a new opening.
How to Fill Out a Sales Report By Location
Work through the template methodically so the finished report is accurate and easy to read:
- Enter the report header: add your company name, the report title, the reporting period (for example, “March 1–31”), and the preparation date.
- List each location: in the first column, write the store name, branch, or region, along with a store number or address if you track multiple sites.
- Record sales revenue: for each location, enter the total revenue generated during the period in the sales column.
- Add unit or transaction counts: log how many items or orders each location processed so you can calculate efficiency.
- Calculate average sale value: divide revenue by transactions to populate the average column.
- Fill the comparison column: enter the prior-period figure or target, then record the difference and percentage change.
- Total the columns: sum revenue, units, and variance into the totals row to produce the company-wide picture.
- Add notes: use the notes field to flag unusual results, then review for accuracy before sharing.
Tips for a More Useful Report
The most actionable reports compare like with like. Use consistent date ranges and the same currency across every location so the numbers are genuinely comparable. Sort locations from highest to lowest revenue, or by variance, so the eye lands on the most important rows first. Whenever a number looks surprising, add a short note explaining why — a one-line context like “closed two days for renovation” prevents misreadings later. Finally, keep prior reports on file so you can build a trend line; a single month tells you little, but six months of location data reveals patterns worth acting on.
How It Differs From a General Sales Report
A standard sales report might summarize total company revenue, product mix, or individual rep performance. A Sales Report By Location specifically slices the data by geography, answering the question “where is our revenue coming from?” rather than “what are we selling?” or “who is selling it?” Many organizations run both: a product report for merchandising decisions and a location report for operations and real-estate decisions. Using the geographic view alongside other reports gives a fuller picture without forcing one document to do everything.
Common Mistakes to Avoid
- Mixing time periods — comparing one location’s monthly figure to another’s quarterly figure produces meaningless conclusions.
- Omitting the totals row, which leaves readers without the company-wide context the report is meant to provide.
- Ignoring variance and showing only raw revenue, so a struggling location that missed target looks fine.
- Inconsistent location names across reports, making it impossible to track the same site over time.
- Forgetting to note one-off events like closures, promotions, or grand openings that distort the numbers.
- Skipping a data-quality check before distribution, which lets transcription errors reach decision-makers.
Frequently Asked Questions
What is a Sales Report By Location used for? It is used to compare revenue and performance across multiple stores, branches, or regions in a single view. Managers rely on it to identify top and bottom performers, plan staffing and inventory, and decide where to invest or cut back. It turns scattered location data into one comparable summary.
How do I fill out a Sales Report By Location? Start with the company name and reporting period, then list each location with its revenue, units sold, and average sale value. Add a comparison against the prior period or target, total every column, and include notes for anything unusual. The numbered steps above walk through each field in order.
How often should I run this report? It depends on your business rhythm — retail and restaurants often run it weekly or even daily, while regional and executive reviews are usually monthly or quarterly. Pick a cadence you can maintain consistently so the data stays comparable over time. Consistency matters more than frequency.
Is this Sales Report By Location template free? Yes. You can download it free in both PDF and DOCX formats with no signup or payment required. The DOCX version is fully editable, so you can add columns, branding, or extra locations to match how your business operates.
Should I use the PDF or the DOCX version? Use the DOCX file when you need to type in data, add rows for new locations, or customize the layout. Use the PDF when you want a clean, fixed copy to print or share for review. Many teams build in DOCX, then export a PDF for distribution.
Does a Sales Report By Location need to be signed or notarized? No. It is an internal business document, not a legal contract, so it generally does not require signatures or notarization. Some companies have the preparer sign or initial it for accountability, but that is a policy choice rather than a legal requirement.
This template is provided as a general example for informational purposes only and does not constitute legal, financial, accounting, or tax advice. Reporting practices and requirements vary by organization and jurisdiction — consult a qualified professional for guidance specific to your business.
Need to work out sales tax? Use our free Sales Tax Calculator to add or remove sales tax from any amount in seconds.
Official resource: for the rules that apply to your situation, see the U.S. Small Business Administration.
Related Forms
- Rebate Tracker
- Small Parts Choking Hazard Warning Tag
- Competitive Analysis
- Commission Summary
- Sales Phone Log
- Price Quote Request Form
Browse more in Sales.