Gantt Chart Eight Weeks
Plan and track projects with this free eight-week Gantt chart template, mapping tasks across two months for clear scheduling — free download.
PDF
DOCX
0
likes
Download Files
- DOCX
A Gantt Chart Eight Weeks template is a visual project planning tool that lays out tasks and their durations across a two-month timeline, helping you schedule, sequence, and track work at a glance. People most commonly use it to manage short-to-medium projects where every task needs a clear start and finish over an eight-week horizon. This template is free to download in PDF and DOCX, with no signup required.
What Is a Gantt Chart Eight Weeks?
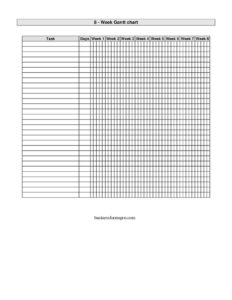
A Gantt Chart Eight Weeks is a horizontal bar chart that displays project tasks down the left side and a timeline of eight consecutive weeks across the top. Each task is represented by a bar that spans the weeks during which it is scheduled to occur. It is typically used by project managers, team leads, students, freelancers, and small-business owners to coordinate work, communicate timelines, and monitor progress. The eight-week span is long enough to capture meaningful project phases yet short enough to stay readable on a single page. Rather than buried text, the chart shows dependencies, overlaps, and deadlines visually, making it easy to spot bottlenecks and keep everyone aligned on what should happen and when.
When Do You Need a Gantt Chart Eight Weeks?
This template fits any situation where work unfolds over roughly two months and needs clear scheduling. Common scenarios include:
- Launching a product or campaign — mapping design, development, review, and release phases week by week.
- Planning an event such as a conference, fundraiser, or wedding, where vendor bookings and milestones span eight weeks.
- Managing an academic project — a thesis, group assignment, or capstone with research, drafting, and revision stages.
- Coordinating a home renovation where trades must be sequenced so plumbing precedes drywall and painting follows.
- Onboarding a new hire with a structured eight-week ramp covering training, shadowing, and independent work.
- Tracking a marketing sprint with content creation, scheduling, publishing, and performance review milestones.
What a Gantt Chart Eight Weeks Should Have
To be genuinely useful, an eight-week Gantt chart should include a clear list of tasks, a labeled timeline of all eight weeks, and a bar or shaded block for each task showing its scheduled duration. Strong charts also identify a responsible owner per task, mark key milestones or deadlines, and indicate dependencies so it is obvious which tasks must finish before others begin. A title and date range anchor the chart in time, while a status indicator or progress shading lets you compare planned versus actual work. Keeping the layout to a single page preserves readability and makes it easy to share with stakeholders.
How to Fill Out a Gantt Chart Eight Weeks
Because this is a flexible visual template, fill it in from the structure outward:
- Add a project title and start date at the top so readers know what the chart covers and when week one begins.
- Label the eight week columns across the header, either as Week 1 through Week 8 or with calendar dates for the Monday of each week.
- List your tasks down the left column in roughly the order they will happen, breaking large efforts into manageable rows.
- Assign an owner beside each task if your version includes a responsibility column.
- Shade or draw a bar across the weeks each task will run, starting in its kickoff week and ending in its completion week.
- Mark milestones — a launch, review, or hard deadline — with a distinct symbol on the relevant week.
- Note dependencies by sequencing bars so a task begins only after its predecessor finishes.
- Update progress weekly by shading completed portions of each bar to track planned versus actual.
Tips for Building an Effective Eight-Week Schedule
Start by working backward from your final deadline so the last task lands in week eight, then place earlier tasks accordingly. Avoid scheduling every task to run the full eight weeks — realistic, varied durations make the chart far more honest and useful. Build in a small buffer near the end for slippage, since few projects finish exactly as drawn. Limit the number of simultaneous tasks each week to what your team can genuinely handle; a wall of overlapping bars is a warning sign of overload. Color-coding by team, phase, or priority can dramatically improve readability. Finally, treat the chart as a living document: review it at the start of each week, adjust bars that have shifted, and re-share the updated version so everyone is working from the same picture.
Gantt Chart vs. a Simple To-Do List
A to-do list tells you what needs doing; a Gantt chart tells you when and in what order. For tasks that all fit in a single day, a list is faster. But once work spans multiple weeks, involves several people, or includes tasks that depend on one another, the eight-week Gantt format becomes far more powerful. It exposes scheduling conflicts before they happen, communicates timing to stakeholders without a meeting, and turns vague intentions into a concrete, trackable plan. Many teams use both: a Gantt chart for the big-picture schedule and short task lists for the day-to-day details within each bar.
Common Mistakes to Avoid
- Cramming too many tasks onto one chart until the bars become unreadable — split very large projects into phases instead.
- Forgetting to assign owners, which leaves tasks scheduled but with no one accountable for them.
- Ignoring dependencies and scheduling tasks to overlap when one truly must finish before the next can start.
- Never updating the chart after the kickoff, so it quickly drifts from reality and loses its value.
- Setting unrealistic durations that compress everything into too few weeks and guarantee missed deadlines.
- Leaving no buffer for delays, illness, or scope changes that inevitably arise during the eight weeks.
Frequently Asked Questions
What is a Gantt Chart Eight Weeks used for? It is used to plan and track a project across a two-month timeline by showing each task as a bar spanning the weeks it runs. This makes it easy to see what happens when, who is responsible, and how tasks overlap or depend on each other.
How do I fill out the eight-week Gantt chart? Add your project title and start date, label the eight week columns, then list your tasks down the left. Draw or shade a bar across the weeks each task will run, mark key milestones, and update the chart weekly to reflect actual progress.
Is this Gantt chart template free? Yes. You can download the Gantt Chart Eight Weeks template free in both PDF and DOCX formats with no signup or account required. The DOCX version is fully editable so you can adapt rows, weeks, and labels to your project.
Can I change the number of weeks or tasks? Absolutely. The DOCX version lets you add or remove task rows and adjust the week columns. While this template is designed around an eight-week window, you can extend or shorten it to match the actual length of your project.
Do I need special software to use it? No. The PDF can be printed and filled in by hand, while the DOCX opens in common word processors so you can shade bars and type details. You do not need dedicated project-management software to get started.
How is a Gantt chart different from a calendar? A calendar shows individual dates and events, while a Gantt chart shows task durations and how they relate to one another across the project. The Gantt format is better for seeing the full sequence of work, dependencies, and overall timeline at a glance.
This template is provided as a general example for informational purposes only and does not constitute project-management, legal, or business advice. Planning needs and best practices vary by project and organization, so adapt this chart to your specific circumstances and consult a qualified professional where appropriate.
Related Forms
- Letter to Legislator Showing Concern
- Entry Form White
- Individual RSVP Form Fancy
- Accident Claim Worksheet
- Gantt Chart Six Weeks
- Days Without An Accident Sign
Browse more in Miscellaneous.