Stock Portfolio
Track your investments with a free Stock Portfolio template, recording shares, prices, and gains or losses — free download in PDF and DOCX.
PDF
XLSX
0
likes
Download Files
- XLSX
A Stock Portfolio is a simple tracking sheet that lists the stocks you own and shows how each holding is performing. People use it most often to keep a running record of share counts, purchase prices, and current value so they can see gains and losses at a glance. You can download this Stock Portfolio template free in PDF and DOCX, with no signup required.
What Is a Stock Portfolio?
A Stock Portfolio is a personal record of the equity investments you hold, organized so each position is easy to review. It is typically maintained by an individual investor, a household managing shared savings, or someone tracking holdings outside of a brokerage app. Rather than logging trades for tax purposes alone, this document captures the present picture: what you own, when you bought it, what you paid, what it is worth now, and how much you have made or lost. It documents each company by name and ticker symbol, the number of shares owned, and the price movement between purchase and today, giving you a clear, line-by-line summary of overall performance.
When Do You Need a Stock Portfolio?
This template is useful any time you want a clear, self-maintained view of your investments rather than scattered statements. Common situations include:
- Tracking holdings across multiple accounts — combining stocks held at different brokers into one consolidated view.
- Monitoring monthly or quarterly performance — recording current value per share to watch how positions trend over time.
- Reviewing before rebalancing — seeing which stocks have gained or lost the most to decide what to buy, hold, or sell.
- Teaching investing basics — students, beginners, or family members learning how share price, cost basis, and returns connect.
- Preparing for a meeting with an advisor — bringing an organized summary of your positions to a financial planning discussion.
- Estimating unrealized gains — checking how much profit or loss exists on paper before making any decisions.
What a Stock Portfolio Should Have
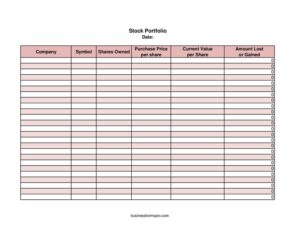
A useful Stock Portfolio captures enough detail to calculate performance without becoming cluttered. The essentials are a date for the snapshot, the company name and its ticker symbol for clear identification, the number of shares owned, the purchase price per share (your cost basis), the current value per share, and the resulting amount lost or gained. Together these let you see both the size of each position and its return. Keeping the date on every entry matters, because share prices change constantly — a value recorded today is only meaningful when you know when it was captured.
How to Fill Out a Stock Portfolio
- Date: Enter the date you are recording the snapshot. Use a consistent format and update it each time you refresh current prices.
- Company: Write the full company name, such as Apple Inc. or Coca-Cola Company, so each holding is unambiguous.
- Symbol: Add the ticker symbol (for example, AAPL or KO). This is helpful when several companies have similar names.
- Shares Owned: Enter the total number of shares you hold for that company, including fractional shares if your broker supports them.
- Purchase Price Per Share: Record what you originally paid per share. If you bought in several lots at different prices, use a weighted average or list each lot separately.
- Current Value Per Share: Enter the latest market price per share as of the date at the top of the row.
- Amount Lost or Gained: Calculate (current value per share − purchase price per share) × shares owned. A positive number is a gain; a negative number is a loss.
Understanding Gains and Losses
The final column does most of the work in a Stock Portfolio, so it helps to understand what it shows. The figure here reflects an unrealized gain or loss — paper performance based on the current market price, not money you have actually pocketed. A gain only becomes realized when you sell the shares, and only realized gains are typically relevant for tax reporting. Keep in mind that the current value per share moves throughout each trading day, so two snapshots taken on different dates will rarely match. Also note that this simple template tracks price movement alone; it does not automatically include dividends, broker fees, or stock splits, which can affect your true return. If those factors matter to you, add notes beside the relevant entries.
Tips for Keeping Your Portfolio Accurate
To get the most from this sheet, update it on a regular schedule — weekly or monthly is plenty for most long-term investors, since checking too often can encourage emotional decisions. Save each version with the date in the file name so you build a history you can compare. When you add a new position, fill in the purchase price immediately while it is fresh, and verify the ticker symbol so you are tracking the right security. If you sell part of a holding, adjust the shares owned and consider noting the sale separately so your remaining cost basis stays correct.
Common Mistakes to Avoid
- Forgetting to date entries: Without a date, the current value per share is meaningless because prices change constantly.
- Mixing up purchase and current price: Reversing these columns flips gains into losses and corrupts your totals.
- Ignoring multiple purchase lots: Using a single price for shares bought at different times misstates your true cost basis.
- Leaving out dividends and fees: Price-only tracking can overstate or understate your real return.
- Not updating after a stock split: A split changes share count and price per share, so old figures will no longer reconcile.
- Math errors in the gain/loss column: Double-check the formula, especially when entering values by hand.
Frequently Asked Questions
What is a Stock Portfolio used for? It is used to track the stocks you own and how each one is performing in one organized place. The sheet records share counts, your cost basis, current value, and the resulting gain or loss so you can review your holdings at a glance.
How do I fill out a Stock Portfolio? Enter the date, company name, and ticker symbol, then add the number of shares owned, the purchase price per share, and the current value per share. The amount lost or gained is calculated as the difference in price multiplied by the number of shares.
How do I calculate the gain or loss on a stock? Subtract your purchase price per share from the current value per share, then multiply by the number of shares owned. A positive result is a gain and a negative result is a loss; it is unrealized until you actually sell.
Does this template include dividends and fees? No, this simple version tracks price movement only — purchase price versus current value. If dividends, commissions, or other costs are important to your return, add them as notes or extra columns.
Is this a substitute for my broker’s statements? It is a convenient personal summary, not an official record. Your brokerage statements remain the authoritative source for trades, tax documents, and exact cost-basis reporting.
How much does this Stock Portfolio template cost? It is completely free to download here in both PDF and DOCX formats, with no signup required. You can edit the DOCX version to add rows, columns, or your own formulas.
This Stock Portfolio template is a general example provided for informational purposes only and is not financial, investment, or tax advice. Investment outcomes and reporting requirements vary by situation and jurisdiction — consult a qualified financial or tax professional before making decisions based on this document.
Official resource: for the rules that apply to your situation, see the Consumer Financial Protection Bureau.
Related Forms
- Fraud Alert Request
- Credit Change Notice
- Check Register Colorful
- Client Income Tracker
- Tip Jar Labels
- List of Accounts
Browse more in Money.