Market Map
Use our free Market Map template to plot competitors, segments, and positioning at a glance — download in PDF or DOCX with no signup required.
PDF
DOCX
0
likes
Download Files
- DOCX
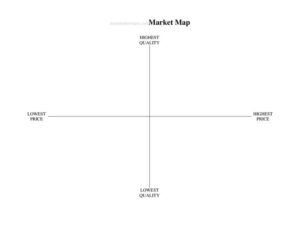
A Market Map is a visual planning tool that plots companies, products, or segments across a defined space so you can see where the opportunities and gaps are. People most often reach for one when they need to understand the competitive landscape before launching a product, raising funding, or refining their positioning. You can download this Market Map template free in both PDF and DOCX formats, with no signup required.
What Is a Market Map?
A Market Map is a one-page framework that organizes a market into clear, comparable parts — typically along two axes (such as price versus quality, or breadth versus specialization) or into categories like segments, sub-segments, and players. It is used by founders, product managers, marketers, strategy teams, and consultants to summarize who competes where, how the market is structured, and which spaces are crowded or underserved. Unlike a long written analysis, the map turns research into a single picture that a team can absorb in seconds. It documents your view of the market at a point in time and becomes a shared reference for decisions about targeting, messaging, and product direction.
When Do You Need a Market Map?
A Market Map earns its place whenever you need to make sense of a crowded or unfamiliar space. Common situations include:
- Launching a new product or service and wanting to see where it sits relative to existing options.
- Preparing a pitch deck or investor update, where a clean landscape slide signals you understand the competition.
- Refining your positioning by spotting the quadrant or category no one else owns.
- Onboarding a new team member who needs a fast, accurate picture of the industry.
- Running a quarterly strategy review to track how rivals have moved and where new entrants have appeared.
- Evaluating partnerships or acquisitions by grouping potential targets and seeing how they cluster.
Types of Market Maps
There is no single correct format — the right one depends on what you are trying to reveal. A 2×2 positioning map plots players on two variables, like price and feature depth, to expose empty quadrants. A segmentation map breaks the market into customer groups or use cases and lists the companies serving each. A category landscape (sometimes called a logo map) sorts brands into functional buckets such as tools, platforms, and services. A value-chain map arranges players by the stage of the process they address. Pick the structure that best answers your central question, then keep your axes or categories consistent so comparisons stay fair.
What a Market Map Should Have
A useful Market Map is more than a scatter of logos. To be credible and reusable, it should include a clear title and the date or period it represents, a defined scope that states which market or segment is in and out of view, and labeled axes or categories with explained criteria so readers know what “high” and “low” mean. Each entry should be a real, identifiable company or product, placed deliberately rather than guessed. A short legend or key helps when you use color, size, or shape to encode extra information such as funding stage or company size. Finally, a notes area lets you record assumptions, sources, and the gaps you have spotted.
How to Fill Out a Market Map
Because this is a flexible visual template, fill it in deliberately rather than rushing to drop logos onto the page:
- Add a title and date. Name the map clearly (for example, “Project Management Tools — Q2”) and stamp the date so future readers know how current it is.
- Define the scope. Write one line stating which market, region, or segment you are mapping and what you are deliberately excluding.
- Choose your structure. Decide between two axes or a set of categories, then label them and note the criteria behind each.
- List the players. Gather the companies or products to include and a quick fact about each so placement is grounded in evidence.
- Place each entry. Position items according to your criteria, keeping the logic consistent across the whole map.
- Add a legend. Explain any colors, sizes, or symbols you use to convey extra detail.
- Capture insights. In the notes area, record the gaps, clusters, and surprises the map reveals, plus your sources.
Tips for Building a Map That Actually Helps
The best Market Maps answer a specific question, so decide that question first: “Where can we win?” leads to different axes than “Who threatens us?” Choose variables that genuinely differentiate players — axes that everyone scores the same on tell you nothing. Resist the urge to include every company; a focused map of the ten most relevant players beats a cluttered one with fifty. Keep your placement honest by basing it on observable facts like pricing pages, feature lists, or public funding data rather than gut feel. Revisit the map on a regular cadence, because markets shift and a stale map can quietly mislead your strategy.
Common Mistakes to Avoid
- Unlabeled or vague axes that leave readers guessing what the positions actually mean.
- Wishful placement, where you put your own product in the ideal spot without evidence to back it up.
- Overcrowding the page with too many players, which buries the insight you were after.
- No date or scope, making it impossible to know how current or relevant the map is later.
- Mixing inconsistent criteria, so some entries are placed by price and others by features.
- Treating it as final rather than updating it as competitors launch, pivot, or exit.
Frequently Asked Questions
What is a Market Map used for? A Market Map is used to visualize a competitive landscape so a team can quickly see how players are positioned and where opportunities exist. It supports decisions about product direction, targeting, and messaging. It is also a common, clean way to present competition in pitch decks and strategy reviews.
How do I choose the right axes for my map? Pick two variables that genuinely separate the players and that matter to your customers, such as price versus capability or generalist versus specialist. Avoid axes where everyone scores the same, since they reveal nothing useful. If two axes feel forced, consider a category or segmentation layout instead.
Is a Market Map the same as a SWOT or competitive analysis? No. A SWOT focuses on one organization’s strengths, weaknesses, opportunities, and threats, while a competitive analysis is usually a detailed written comparison. A Market Map is a higher-level visual that shows how many players relate to one another across the whole space, and the three tools complement each other well.
How often should I update my Market Map? Update it whenever the market shifts meaningfully — when a notable competitor launches, pivots, merges, or exits. Many teams refresh it quarterly alongside other planning documents. Always keep the date visible so anyone viewing it knows how current the snapshot is.
Can I use this template for any industry? Yes. The Market Map template is industry-agnostic, so it works equally well for software, consumer products, professional services, or B2B markets. You simply adapt the axes, categories, and players to fit your specific space.
Is this Market Map template really free? Yes. You can download this Market Map template at no cost in both PDF and DOCX formats, with no signup or account required. The editable DOCX lets you customize axes, labels, and entries, while the PDF is handy for quick printing or sharing.
This Market Map template is a general example provided for informational purposes only and does not constitute legal, financial, or business advice. Market conditions and the appropriate framework vary by industry and situation — consult a qualified professional before making strategic decisions based on your analysis.
Official resource: for the rules that apply to your situation, see the U.S. Small Business Administration.
Related Forms
- Appointment Request Form
- Wedding Reservation Form
- Lobby Hours
- Hotel Reservation Form
- Beauty Salon Appointment
- Appointment Change Form
Browse more in Office.