Flow Chart
Map any process visually with a free flow chart template — download in PDF and DOCX, no signup, to diagram steps, decisions, and workflows clearly.
PDF
DOCX
0
likes
Download Files
- DOCX
A flow chart is a visual diagram that maps the steps, decisions, and outcomes of a process from start to finish. People most often reach for a flow chart when they need to explain or standardize how something gets done — whether that’s an approval workflow, a customer support path, or a manufacturing sequence. You can download this flow chart template for free in both PDF and DOCX formats, with no signup required.
What Is a Flow Chart?
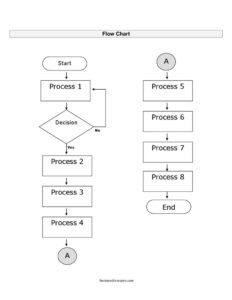
A flow chart is a graphical representation of a process, using connected shapes and arrows to show the order in which actions occur. Each shape carries a standard meaning: ovals mark the start and end, rectangles represent tasks or steps, diamonds indicate decisions, and arrows show the direction of flow. Flow charts are used by business analysts, project managers, software developers, operations teams, educators, and anyone who needs to clarify a sequence of activities. The document is valuable because it turns a written or verbal procedure into something the whole team can see at a glance, making bottlenecks, redundancies, and decision points easy to spot and discuss.
When Do You Need a Flow Chart?
A flow chart is useful any time a process is complex enough that words alone create confusion. Common situations include:
- Documenting a workflow — mapping how an order moves from request to fulfillment so new hires can follow it.
- Designing an approval process — showing who signs off at each stage and what happens when a request is rejected.
- Troubleshooting and support — guiding staff through a decision tree to diagnose a customer issue.
- Software and systems design — outlining program logic, data flow, or user journeys before writing code.
- Process improvement — visualizing a current procedure to identify steps that can be removed or automated.
- Training and onboarding — giving employees a clear, repeatable picture of standard operating procedures.
Common Types of Flow Charts
Several styles serve different goals. A process flow chart documents a straightforward sequence of tasks. A swimlane diagram divides steps across columns to show which person or department owns each action. A decision flow chart emphasizes branching logic with multiple yes/no paths. A data flow diagram tracks how information moves between systems. This template is flexible enough to adapt to any of these — you simply choose the shapes and connectors that fit your process.
What a Flow Chart Should Have
A complete, easy-to-read flow chart includes a few essential elements that keep it clear and consistent:
- A title that names the process being mapped.
- A clear start point (usually an oval) and a defined end point.
- Process steps in rectangles, each describing a single action in plain language.
- Decision points in diamonds, phrased as questions with labeled branches such as “Yes” and “No.”
- Directional arrows connecting every shape so the reader never loses the sequence.
- A consistent layout — typically top-to-bottom or left-to-right — and, where helpful, a legend explaining any custom symbols.
How to Fill Out a Flow Chart
Because this is a blank, flexible template, you build the chart by adding and labeling shapes. Follow these steps:
- Add a title at the top naming the process, for example “Customer Refund Request.”
- Define the scope by deciding where the process begins and ends before you draw anything.
- Place a start shape (oval) and label it “Start” or with the triggering event.
- List each step in order, placing a rectangle for every distinct action and writing a short verb-led description inside it.
- Insert decision diamonds wherever the path can split, writing a yes/no question and labeling each outgoing arrow.
- Connect the shapes with arrows that show the exact direction of flow, including loop-backs for rework.
- Add an end shape (oval) marking each possible conclusion of the process.
- Review the logic by tracing every path from start to finish to confirm no step or branch is left hanging.
Tips for Designing a Clear Flow Chart
Keep each step to a single action and use consistent, concise wording so the chart reads quickly. Limit the number of decision branches on one page; if a process grows too large, split it into linked sub-charts with a connector reference. Maintain a uniform flow direction and even spacing between shapes — visual consistency signals professionalism and reduces misreading. Use color sparingly and only to convey meaning, such as highlighting exception paths or owner responsibilities. Finally, have someone who actually performs the process review your draft, since the people closest to the work often catch missing steps that a diagram-maker overlooks.
Flow Chart vs. Process Map vs. Checklist
These tools are related but not interchangeable. A checklist simply lists tasks to complete without showing branching or order dependencies. A process map often covers a broader view of an end-to-end business process, sometimes spanning multiple departments. A flow chart sits between them, focusing on the precise sequence and decision logic of a specific procedure. Choose a flow chart when the order of steps and the conditions that change that order are what matter most.
Common Mistakes to Avoid
- Mixing shape meanings — using a rectangle for a decision or an oval for a step confuses readers familiar with standard symbols.
- Leaving arrows undirected — every connector should clearly show which way the flow moves.
- Forgetting alternate paths — decisions need both outcomes mapped, including what happens on “No.”
- Overcrowding one page — cramming too many steps makes the chart unreadable; break it up instead.
- Vague step labels — wording like “Handle it” tells no one what to actually do.
- Skipping a real end point — a process that trails off without a defined conclusion leaves users uncertain.
Frequently Asked Questions
What is a flow chart used for? A flow chart is used to document and communicate the steps and decisions in a process visually. It helps teams standardize procedures, train new staff, troubleshoot issues, and spot inefficiencies. Because it shows order and branching at a glance, it is far clearer than a long written description.
How do I fill out this flow chart template? Start by titling the process, then add a start oval, place a rectangle for each step, insert diamonds for decisions, and connect everything with directional arrows ending in a clear stop point. Keep labels short and action-oriented. Trace each path from start to finish to make sure the logic holds together.
What do the different shapes mean? Ovals mark the start and end of the process, rectangles represent individual steps or actions, and diamonds represent decision points with branching outcomes. Arrows connect the shapes to show the direction of flow. Sticking to these standard symbols makes your chart instantly understandable to others.
Is this flow chart template free to download? Yes. You can download this flow chart template for free in both PDF and DOCX formats, with no signup or payment required. The DOCX version is fully editable so you can add, move, and relabel shapes to fit your exact process.
Can I use a flow chart for any kind of process? Yes. Flow charts work for business workflows, software logic, customer service scripts, manufacturing steps, educational explanations, and personal planning. The same template adapts to all of these because you control the content and arrangement of the shapes.
What is the difference between a flow chart and a swimlane diagram? A standard flow chart shows the sequence of steps and decisions in a process. A swimlane diagram adds columns or rows that assign each step to a specific person, role, or department. Use a swimlane version when responsibility and hand-offs are as important as the sequence itself.
This flow chart template is provided as a general example for informational purposes only and does not constitute legal, financial, or professional advice. Process and documentation requirements vary by organization and industry, so consult a qualified professional or your internal standards when accuracy is critical.
Related Forms
- Logic Model
- Course Syllabus
- Driving Directions With Map
- Dog Training Behavior Questionnaire
- Maximum Capacity Sign
- Raffle Ticket White
Browse more in Miscellaneous.