PICK Chart
Prioritize improvement ideas with a free PICK Chart template — sort projects into Possible, Implement, Challenge, or Kill. Free PDF and DOCX download.
PDF
DOCX
0
likes
Download Files
- DOCX
A PICK Chart is a simple prioritization tool that helps teams decide which ideas or projects to act on by sorting them by payoff and ease of implementation. People most often reach for it during continuous improvement and Lean Six Sigma sessions when a brainstorm has produced more ideas than the team can possibly tackle. This template is free to download in both PDF and DOCX, with no signup required.
What Is a PICK Chart?
A PICK Chart is a four-quadrant decision matrix used to evaluate and rank potential projects or process improvements. The acronym PICK stands for Possible, Implement, Challenge, and Kill — the four categories an idea can fall into based on how much benefit it delivers versus how hard it is to carry out. It is typically created and used by improvement teams, facilitators, project managers, and Lean practitioners during a kaizen event or planning workshop. The chart documents each candidate project, its estimated cost or effort, and where it lands on the grid, giving everyone a shared, visual basis for deciding where to focus limited time and resources.
When Do You Need a PICK Chart?
Reach for a PICK Chart whenever you have more good ideas than capacity to execute them. Common situations include:
- After a brainstorming session when dozens of improvement suggestions need to be narrowed down to a manageable few.
- During a Lean or Six Sigma kaizen event where teams must quickly agree on which countermeasures to pilot first.
- Annual or quarterly planning, to rank competing department initiatives against budget and bandwidth.
- Backlog grooming for a project or product team that wants to separate quick wins from long, complex efforts.
- Cost-conscious decision-making, when leadership wants a clear view of which projects deliver high value at low cost.
- Resolving disagreements on a team by replacing opinion with a visible, structured comparison of effort versus impact.
Understanding the Four Quadrants
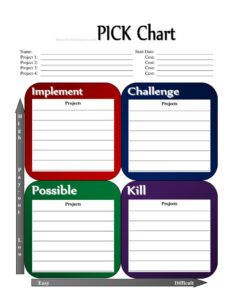
The power of the chart comes from the meaning behind each quadrant. Implement covers easy, high-payoff ideas — the quick wins you should start immediately. Challenge holds hard but high-payoff projects worth planning carefully because the reward justifies the effort. Possible contains easy, low-payoff items you can do if time allows. Kill is for hard, low-payoff ideas that simply are not worth the resources. Placing each project into one of these boxes turns a long, flat list into a clear action plan.
What a PICK Chart Should Have
A complete PICK Chart documents enough detail to make and defend the team’s decisions later. It should include a clear chart name or title that identifies the session or initiative, a start date for context, and a list of the candidate projects under consideration. Each project should have an associated cost or effort estimate so the team can weigh investment against benefit. Finally, it should show the placement of every project into the appropriate quadrant, so anyone reviewing the chart can immediately see which ideas were greenlit, deferred, or set aside.
How to Fill Out a PICK Chart
- PICK Chart Name: Enter a descriptive title that identifies the event or topic — for example, “Q3 Warehouse Efficiency Improvements” or “Customer Onboarding Kaizen.”
- Start Date: Record the date the chart was created or the date the prioritization session took place. This anchors the chart in time and helps track decisions over multiple rounds.
- Project 1 and Cost: Write the name of the first candidate idea, then enter its estimated cost or effort. Keep the description short but specific so everyone knows exactly what the project entails.
- Project 2 and Cost: Add the second project and its cost estimate. Use a consistent unit — dollars, hours, or a simple low/medium/high scale — across all entries.
- Project 3 and Cost: Continue with the third project and its associated cost.
- Project 4 and Cost: List the fourth project and its cost. Add more rows if your session generated additional ideas.
- Projects (placement): Finally, plot each project into the Possible, Implement, Challenge, or Kill quadrant based on team consensus about its payoff and difficulty.
Tips for Running an Effective PICK Chart Session
Keep the exercise fast and collaborative. Have the team agree on what “high payoff” and “easy to implement” mean before placing items, since shared definitions prevent arguments later. Use sticky notes or digital cards so projects can be moved around as discussion evolves — placement is rarely final on the first pass. Time-box the session to keep momentum, and resist the urge to over-analyze; the chart is meant to give a quick, directional read, not a precise financial model. Once placements settle, assign owners to the Implement quadrant immediately so the quick wins do not stall after the meeting ends.
PICK Chart vs. Other Prioritization Tools
A PICK Chart is closely related to an effort-impact matrix and an action priority matrix, but it uses friendlier, action-oriented labels. Unlike a full cost-benefit analysis or a weighted scoring model, it is deliberately simple and qualitative, which makes it ideal for rapid team decisions rather than detailed financial justification. If your projects require precise ROI calculations, use the PICK Chart as a first-pass filter and follow up with a deeper analysis on the surviving candidates in the Implement and Challenge quadrants.
Common Mistakes to Avoid
- Vague project names that mean different things to different people, leading to inconsistent placement.
- Skipping cost estimates, which removes the effort dimension the chart depends on.
- Treating placement as permanent instead of revisiting it as new information emerges.
- Letting one strong voice dominate rather than building genuine team consensus on each quadrant.
- Forgetting to assign owners to Implement items, so quick wins never actually get done.
- Putting too many ideas on one chart, which clutters the grid and slows decision-making — split large lists into themed charts instead.
Frequently Asked Questions
What does PICK stand for in a PICK Chart? PICK stands for Possible, Implement, Challenge, and Kill. Each word names one quadrant of the grid, defined by the combination of payoff (low or high) and ease of implementation (hard or easy).
Who uses a PICK Chart? Improvement teams, Lean and Six Sigma practitioners, project managers, and facilitators use it most often. It is also useful for any group that needs to prioritize a list of competing ideas quickly and visually.
How do I decide which quadrant a project belongs in? Assess two things: how much benefit the project delivers and how difficult or costly it is to implement. High payoff plus easy effort goes in Implement; high payoff plus hard effort goes in Challenge; low payoff plus easy effort goes in Possible; and low payoff plus hard effort goes in Kill.
Is a PICK Chart only for Lean Six Sigma? No. While it originated in Lean improvement work, it works for any prioritization decision — marketing campaigns, software backlogs, facility upgrades, or personal project planning. The simple effort-versus-impact logic applies broadly.
How is the cost field used? The cost field captures the estimated effort or expense of each project, which informs how easy or hard it is to implement. You can use dollars, hours, or a simple low/medium/high scale, as long as you stay consistent across all projects.
How much does this PICK Chart template cost? It is completely free to download from Business Forms Pro in both PDF and DOCX formats, with no signup or payment required. You can edit the DOCX version to add rows, rename categories, or match your team’s branding.
This PICK Chart template is provided as a general example for informational purposes only and does not constitute professional, financial, or management consulting advice. Prioritization methods and their suitability vary by organization and situation — adapt the tool to your own context and consult a qualified professional where appropriate.
Related Forms
- Individual RSVP Form Fancy
- Volunteer Badges
- Business Purchase Proposal
- Articles of Incorporation
- Maximum Capacity Sign
- Accident Claim Worksheet
Browse more in Miscellaneous.