Projected Sales
Use this free Projected Sales template to forecast and track daily and weekly revenue against actual results — free PDF and DOCX download.
PDF
DOCX
0
likes
Download Files
- DOCX
A Projected Sales form is a simple planning sheet used to estimate how much revenue you expect to bring in each day of the week and then compare those forecasts against what you actually earn. Businesses use it most often to set realistic daily targets, hold salespeople accountable, and spot gaps between expectation and reality. You can download this template free in both PDF and DOCX formats — no signup required.
What Is a Projected Sales Form?
A Projected Sales form is a forecasting and tracking document that lays out the seven days of the week alongside columns for projected sales and actual sales. It is typically created by a manager, business owner, or sales lead and filled in by a salesperson or shift supervisor. The form documents what you predicted you would sell, what you genuinely sold, who was responsible, and the resulting daily and weekly totals. Its purpose is twofold: it sets clear expectations before the week begins and provides a record for review afterward. Because it captures both sides of the equation — plan versus outcome — it becomes a quick diagnostic tool for performance, staffing decisions, and revenue planning.
When Do You Need a Projected Sales Form?
This form fits almost any business that earns revenue on a recurring weekly rhythm. Common situations include:
- Retail stores setting daily floor targets and comparing them against register totals at closing.
- Restaurants and cafes forecasting covers and revenue by day, since weekends often run very differently from Mondays.
- Sales teams assigning individual quotas and tracking each salesperson’s contribution to the weekly number.
- Small business owners building a weekly cash-flow estimate to plan inventory orders and payroll.
- Franchise or multi-location managers rolling up consistent weekly figures across sites for easy comparison.
- Seasonal or pop-up operators who need a lightweight way to gauge whether a short run is meeting expectations.
Anytime you want to move from “hoping for a good week” to measuring a planned one, this form gives you the structure to do it without complicated software.
What a Projected Sales Form Should Have
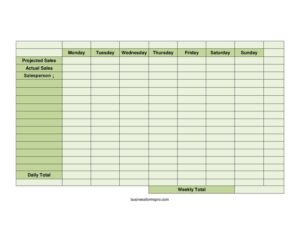
A complete Projected Sales form should make the comparison between plan and result effortless to read at a glance. The essential elements are a clearly labeled row or column for each day of the week (Monday through Sunday), a projected sales figure for each day, an actual sales figure recorded after business closes, and the name of the salesperson responsible for the period. It should also total the numbers two ways: a daily total that confirms each day’s performance and a weekly total that sums the entire period. When every cell is filled in, the variance between projection and actual becomes obvious — and that variance is the real value of the document.
How to Fill Out a Projected Sales Form
- Enter the salesperson name (or store, shift, or team) the sheet covers, so the figures are tied to an accountable owner.
- Working day by day from Monday through Sunday, write your projected sales for each — base these on prior weeks, seasonality, and any promotions planned.
- Leave the actual sales column blank until each day closes; never pre-fill it, or you lose the comparison.
- At the end of each business day, record the real revenue in the actual sales cell for Monday, Tuesday, Wednesday, and so on.
- Calculate the daily total for each day, combining figures if the sheet tracks multiple categories or registers.
- Once all seven days are complete, add the column to produce the weekly total for both projected and actual numbers.
- Compare projected versus actual side by side, note the variance, and carry insights forward when you forecast the next week.
How to Use Projections to Improve Performance
The numbers only matter if you act on them. After a week is logged, look at the days where actual sales fell short of projection and ask why — was traffic low, was staffing thin, did a promotion underperform? Days that beat projection are just as informative: they may reveal an underestimated peak you can staff for or stock more heavily next time. Over several weeks, patterns emerge that make your future projections far more accurate, turning guesswork into a reliable planning rhythm. Many managers keep a stack of completed sheets to track trends month over month, which also helps justify budget, payroll, and inventory decisions with hard evidence rather than instinct.
Projected Sales vs. a Sales Report
It helps to know how this form differs from a plain sales report. A sales report typically records only what happened — actual revenue, transactions, and totals after the fact. A Projected Sales form is forward-looking first: it captures your expectation before the period and then layers in actual results so you can measure accuracy. In other words, a sales report answers “what did we sell?” while a Projected Sales form answers “did we hit the plan, and by how much did we miss or beat it?” That comparison is what makes this template a planning tool rather than just a record.
Common Mistakes to Avoid
- Setting unrealistic projections — wildly optimistic numbers demoralize staff and make the variance meaningless.
- Forgetting to record actual sales daily — reconstructing a week from memory introduces errors and defeats the purpose.
- Leaving the salesperson field blank, which makes it impossible to tie results to accountability.
- Mixing time periods — combining two weeks on one sheet muddies the weekly total.
- Ignoring the variance — filling in numbers but never comparing projected to actual wastes the entire exercise.
- Math errors in the daily or weekly totals; always double-check the column sums before relying on them.
Frequently Asked Questions
What is a Projected Sales form used for? It is used to forecast expected revenue for each day of the week and then compare those projections against actual sales. Businesses rely on it to set targets, measure performance, and plan staffing and inventory based on realistic expectations.
How do I fill out the projected sales column? Estimate each day’s revenue using past sales data, seasonal trends, and any planned promotions, then enter that figure in the projected column from Monday through Sunday. Leave the actual sales column empty until each day closes so the comparison stays honest.
What is the difference between projected and actual sales? Projected sales are your forecast made before the period begins, while actual sales are the real revenue recorded after business closes. The gap between the two — the variance — tells you how accurate your planning was and where to adjust.
Who should fill out this form? Typically a manager or business owner sets the projections, and the salesperson, cashier, or shift supervisor records the actual figures at the end of each day. Listing a responsible salesperson keeps the results accountable.
Is this Projected Sales template free to download? Yes. You can download it free in both PDF and DOCX formats with no signup required, and you are welcome to customize the days, columns, or totals to match how your business operates.
How often should I use a Projected Sales form? Most businesses use one per week, since the template is built around a Monday-to-Sunday cycle. Keeping a running file of completed weeks lets you spot trends and steadily improve the accuracy of future projections.
This template is a general example provided for informational purposes only and does not constitute financial, accounting, or business advice. Forecasting practices and reporting requirements vary by business and jurisdiction — consult a qualified accountant or financial professional for guidance specific to your situation.
Official resource: for the rules that apply to your situation, see the Consumer Financial Protection Bureau.
Related Forms
- Profit And Loss Worksheet
- Account Balance
- Break Even Analysis
- Pocket Tip Calculator
- Emergency Cash Envelope
- Account Reconciliation Form
Browse more in Money.