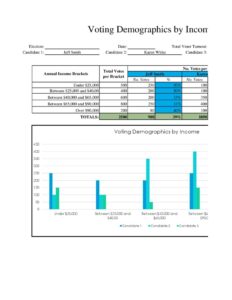
Voting Demographics By Income
Track and analyze voter participation across income brackets with this free Voting Demographics by Income template, available as a free PDF and DOCX download.
PDF
XLSX
0
likes
Download Files
- XLSX
A Voting Demographics by Income form is a structured worksheet for recording and analyzing how voter participation, registration, and turnout break down across different household income brackets. Campaigns, researchers, civic organizations, and political analysts use it to understand which income groups are engaged, where outreach is needed, and how economic factors correlate with voting behavior. It is free to download in PDF and DOCX, with no signup required.
What Is a Voting Demographics by Income Form?
A Voting Demographics by Income form is a data-collection and reporting tool that organizes voter information by income range — for example, under $25,000, $25,000–$50,000, $50,000–$100,000, and above. It is typically maintained by campaign data teams, nonpartisan civic groups, academic researchers, or polling organizations. The document captures counts of registered voters, ballots cast, and turnout percentages within each economic tier, often alongside geographic or precinct details. Rather than functioning as an official government record, it serves as an internal analytical instrument that turns raw numbers into actionable insight about which segments of the electorate are participating and which are underrepresented.
When Do You Need a Voting Demographics by Income Form?
This form is useful any time you need to connect economic data to electoral behavior. Common scenarios include:
- Campaign targeting: A field team wants to allocate canvassing resources toward income groups with low historical turnout.
- Academic research: A political science researcher studies the relationship between household income and voter participation across several election cycles.
- Nonprofit voter outreach: A civic organization measures whether registration drives in lower-income neighborhoods are improving turnout.
- Post-election analysis: An analyst compiles results to report how each income bracket voted and at what rate after polls close.
- Grant reporting: A foundation-funded program documents demographic reach to demonstrate impact to funders.
- Policy advocacy: An advocacy group illustrates participation gaps to support arguments for accessibility or voter-engagement reforms.
What a Voting Demographics by Income Form Should Have
To produce credible, comparable data, the form should clearly label the reporting period (such as a specific election date), the geographic scope (city, county, precinct, or district), and the source of the data. Each income bracket should be defined with consistent thresholds so figures can be compared cleanly. The most useful versions include columns for the number of eligible or registered voters, the number who actually voted, and a calculated turnout percentage. Space for notes — explaining methodology, data limitations, or sampling approach — adds transparency. Finally, a section identifying who prepared the document and when keeps the record accountable and lets reviewers trace the figures back to their origin.
How to Fill Out a Voting Demographics by Income Form
- Title and reporting period: At the top, name the report and enter the election date or date range the data covers.
- Geographic scope: Specify the jurisdiction — state, county, district, or precinct — so the figures have clear boundaries.
- Data source: Record where the numbers came from, such as voter file matches, exit polls, census-linked estimates, or survey responses.
- Define income brackets: List each income range in its own row, keeping the thresholds consistent (for example, under $25K, $25K–$50K, $50K–$75K, $75K–$100K, over $100K).
- Enter registered or eligible counts: For each bracket, fill in the number of registered or eligible voters.
- Enter ballots cast: Record how many voters in that bracket actually voted.
- Calculate turnout: Divide ballots cast by the registered count to get a turnout percentage for each row.
- Add totals: Sum each column at the bottom to produce overall figures.
- Notes and methodology: Use the notes area to explain assumptions, margins of error, or data gaps.
- Prepared by: Sign or initial, add your role, and date the form.
Reading and Interpreting the Data
The numbers only become valuable once you interpret them carefully. Turnout percentage — not raw ballot count — is usually the most revealing figure, because a bracket with fewer registered voters can still show high engagement. Compare turnout rates side by side to spot gaps: if lower-income brackets consistently show lower participation, that pattern can guide outreach strategy. Watch for the difference between eligible, registered, and voting populations, since mixing these inflates or deflates rates. When possible, track the same brackets across multiple elections to reveal trends rather than one-time snapshots. Always pair the figures with the methodology note so readers understand whether the data reflects an entire population or a sample.
Keeping the Data Accurate and Ethical
Because this form deals with people’s economic information and voting behavior, accuracy and privacy matter. Use aggregated counts rather than individually identifiable records whenever possible, and avoid attaching names to income estimates. Income data is frequently modeled or estimated rather than directly reported, so label estimates clearly so no one mistakes them for verified facts. Apply identical bracket definitions across every report you compare, and document any change in methodology between cycles. Treating the data responsibly protects both the people represented and the credibility of your analysis.
Common Mistakes to Avoid
- Inconsistent brackets: Changing income ranges between reports makes comparisons meaningless.
- Confusing registered with eligible voters: This skews turnout percentages and undermines conclusions.
- Omitting the data source: Without a stated source, figures can’t be verified or trusted.
- Treating estimates as exact: Modeled income data should always be flagged as approximate.
- Forgetting the reporting period: Numbers without an election date or timeframe lose context.
- Skipping totals or miscalculating percentages: Arithmetic errors quietly distort the entire analysis.
Frequently Asked Questions
What is a Voting Demographics by Income form used for? It is used to organize and analyze voter registration, turnout, and participation across household income brackets. Campaigns, researchers, and civic groups rely on it to identify engagement gaps and guide outreach. It turns raw electoral numbers into a clear, comparable view of how different economic groups participate.
Where does the income and voting data come from? Data can come from public voter files, post-election surveys, exit polls, census-linked estimates, or internal canvassing records. Income is often estimated or modeled rather than directly reported by individuals. Always note your source on the form so readers understand how the figures were derived.
Is this form an official government document? No, it is an internal analytical worksheet rather than an official record filed with any election authority. It is meant for research, planning, and reporting purposes. Official voter records and certified results come from your local election office.
How do I calculate turnout for each income bracket? Divide the number of ballots cast within a bracket by the number of registered (or eligible) voters in that same bracket, then multiply by 100. Keep the denominator consistent across rows so percentages are comparable. Document which population you used to avoid confusion.
Does this form raise privacy concerns? It can, which is why aggregated counts are strongly preferred over individually identifiable records. Avoid linking names to specific income figures, and follow any applicable privacy rules for the data you collect. Responsible handling protects both individuals and the integrity of your analysis.
How much does this template cost? Nothing — it is completely free to download from Business Forms Pro in both PDF and DOCX formats, with no signup required. You can edit the DOCX version to add or adjust income brackets and columns. Use it as a starting point and customize it to fit your project.
This template is provided as a general example for informational purposes only and is not legal, statistical, or research-methodology advice. Data-collection requirements, privacy obligations, and election rules vary by jurisdiction. Consult a qualified professional or your local election authority before relying on collected data for official or published use.
Related Forms
- Campaign Endorsement Request Letter
- Opinion Poll
- Campaign Volunteer Sign Up Sheet
- Endorsements Tracker
- Electorate Information
- Voting Demographics By Affiliation
Browse more in Political.