Hourly Wage Chart
Use our free Hourly Wage Chart template to convert hourly pay into daily, weekly, monthly, and annual totals — free download in PDF and DOCX.
PDF
DOCX
0
likes
Download Files
- DOCX
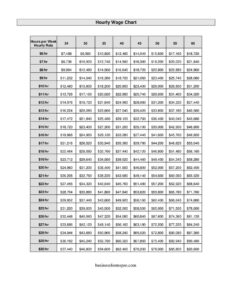
An Hourly Wage Chart is a simple reference table that converts an hourly pay rate into daily, weekly, monthly, and yearly earnings so employers and employees can see exactly what a wage adds up to over time. People most often use it to set pay scales, compare job offers, or build a payroll budget. It is free to download here in both PDF and DOCX formats, with no signup required.
What Is an Hourly Wage Chart?
An Hourly Wage Chart is a tool — usually a grid — that lists hourly rates down one side and shows the equivalent earnings across different time periods, such as per shift, per week, per month, and per year. It is used by small business owners, HR coordinators, hiring managers, bookkeepers, and job seekers who want a quick, consistent way to translate “$X per hour” into real budgeting numbers. Rather than recalculating every time, the chart documents standard assumptions (for example, a 40-hour week or 2,080-hour year) so everyone references the same figures. It does not replace a payroll system, but it gives a clear, at-a-glance picture of compensation that makes pay conversations, offer letters, and budget planning faster and more transparent.
When Do You Need an Hourly Wage Chart?
An Hourly Wage Chart is handy any time someone needs to translate an hourly rate into a bigger-picture number. Common situations include:
- Setting wage scales: A business defines pay tiers for different roles and wants each one expressed in weekly and annual terms.
- Comparing job offers: A candidate evaluates two hourly positions and needs to see which actually pays more over a year.
- Budgeting payroll: An owner forecasts labor costs for a new hire across a quarter or fiscal year.
- Posting transparent pay: A job listing shows both the hourly rate and the annualized equivalent for clarity.
- Negotiating raises: An employee illustrates how a small hourly increase translates to monthly and yearly take-home growth.
- Onboarding part-time staff: A manager shows new hires how variable weekly hours affect their expected pay.
What an Hourly Wage Chart Should Have
A complete and useful Hourly Wage Chart includes a clearly labeled column or row for the hourly rate, plus columns for each time period you want to convert to — typically daily, weekly, biweekly, monthly, and annual amounts. It should state the assumptions used, such as the number of hours per day, hours per week, and weeks or hours per year, so the math is transparent. A title and a date or version note help when assumptions change. If overtime matters, a separate note or column for time-and-a-half is valuable. Finally, a space for the company name or a label identifying the role or pay tier keeps the chart organized when several versions exist.
How to Fill Out an Hourly Wage Chart
Because this is a flexible reference template, you complete it by entering your own rates and assumptions:
- Add a title and identifier. Label the chart (for example, “2024 Hourly Wage Chart — Retail Staff”) and add a date so you know which version you are using.
- Set your assumptions. Enter the standard hours per day, hours per week, and weeks or total hours per year. A common baseline is 8 hours/day, 40 hours/week, and 2,080 hours/year.
- List the hourly rates. In the first column, enter each rate you want to chart — for instance $15.00, $16.50, $18.00, and so on.
- Calculate daily pay. Multiply each rate by hours per day and enter it in the daily column.
- Calculate weekly and biweekly pay. Multiply the rate by weekly hours; double for a biweekly figure if you pay every two weeks.
- Calculate monthly pay. Multiply weekly pay by 52 and divide by 12 for an accurate monthly average.
- Calculate annual pay. Multiply the rate by total yearly hours to get the gross annual figure.
- Note overtime if needed. Add a line showing the time-and-a-half rate for hours over 40 in a week.
Understanding the Math Behind the Chart
The reliability of an Hourly Wage Chart comes entirely from the assumptions you choose. A full-time year of 2,080 hours assumes 40 hours per week for all 52 weeks with no unpaid time off — so actual take-home pay may differ once holidays, paid leave, or unpaid breaks are factored in. For part-time roles, lower your weekly hours and recalculate every column, since a chart built on 40 hours will badly overstate a 20-hour-per-week position. Remember that these figures are gross amounts before taxes, insurance, retirement contributions, and other deductions. Keeping the assumptions visible on the chart prevents misunderstandings when an employee compares the annual figure on the chart to the smaller amount on their paycheck.
Gross Pay vs. Net Pay
One of the most useful things a wage chart can clarify is the difference between gross and net pay. The chart shows gross earnings — the total before anything is withheld. Net pay, what actually lands in a bank account, is lower after federal, state, and local taxes, Social Security and Medicare, health premiums, and any voluntary deductions. If you share the chart with employees or candidates, add a short note explaining that the numbers are pre-tax estimates. This keeps expectations realistic and reduces confusion during onboarding or salary discussions.
Common Mistakes to Avoid
- Hiding the assumptions: A chart without stated hours-per-week or weeks-per-year is impossible to verify and easy to misread.
- Mixing part-time and full-time math: Applying a 40-hour formula to a 25-hour role overstates earnings dramatically.
- Ignoring overtime rules: Forgetting time-and-a-half can understate true labor costs and pay obligations.
- Presenting gross as net: Letting people assume the annual figure is take-home pay leads to disappointment.
- Forgetting to update rates: An outdated chart with last year’s wages can cause budgeting and offer errors.
- Rounding inconsistently: Mixing rounded and exact figures across columns makes the chart look unreliable.
Frequently Asked Questions
What is an Hourly Wage Chart used for? It is a quick-reference table that converts an hourly rate into daily, weekly, monthly, and annual earnings. Employers use it to set pay scales and budget payroll, while employees and job seekers use it to understand and compare offers. It saves time by standardizing the conversion math so everyone works from the same numbers.
How do I convert an hourly wage to an annual salary? Multiply the hourly rate by the number of hours worked per week, then multiply by the number of weeks worked per year. The common full-time assumption is 40 hours per week for 52 weeks, which equals 2,080 hours — so $20 per hour becomes $41,600 per year before taxes. Adjust the hours or weeks to match part-time or seasonal schedules.
Are the figures on the chart before or after taxes? The amounts on an Hourly Wage Chart are gross figures, meaning they are calculated before any taxes or deductions. Actual take-home (net) pay will be lower after withholding for income tax, Social Security, Medicare, and benefits. It helps to add a note clarifying this whenever you share the chart.
Does this chart account for overtime? The base chart calculates straight-time pay. If your workers may exceed 40 hours in a week, add a separate line or column for the overtime rate, typically one and a half times the regular hourly rate. Overtime rules vary by jurisdiction, so confirm the requirements that apply to your workplace.
Can I customize the time periods and assumptions? Yes. The DOCX version is fully editable, so you can change the hourly rates, hours per day, hours per week, and weeks per year to match your business. You can also add or remove columns, such as a biweekly or quarterly figure, to fit your payroll cycle.
Is this Hourly Wage Chart free to download? Yes. You can download the Hourly Wage Chart here for free in both PDF and DOCX formats with no signup required. Use the PDF for a clean printout or share the DOCX to edit the rates and assumptions for your own roles.
This Hourly Wage Chart template is provided as a general example for informational purposes only and does not constitute legal, financial, tax, or payroll advice. Wage, overtime, and recordkeeping requirements vary by jurisdiction and change over time. Consult a qualified accountant, payroll professional, or employment attorney to confirm the rules that apply to your situation.
Official resource: for the rules that apply to your situation, see the U.S. Department of Labor.
Related Forms
- Organizational Chart
- Employee Self Evaluation
- Employee Separation Form
- Direct Deposit Authorization
- Paycheck Authorization Form
- Termination Checklist
Browse more in Employment.