Company Growth Chart
Track revenue, headcount, and key metrics over time with this free Company Growth Chart template — free download in PDF and DOCX.
PDF
DOCX
0
likes
Download Files
- DOCX
A Company Growth Chart is a simple tracking document that records how your business expands over time across metrics like revenue, customer count, headcount, and market reach. People most often use it to visualize progress month over month or year over year and to spot trends worth acting on. It’s free to download here in both PDF and DOCX formats, with no signup required.
What Is a Company Growth Chart?
A Company Growth Chart is a structured log that captures a business’s performance figures at regular intervals so you can compare them side by side. It is typically maintained by founders, finance staff, operations managers, or department heads who want a single reference point for how key numbers are moving. Rather than scattering data across spreadsheets and slide decks, the chart consolidates measures such as sales, profit, new clients, and team size into one ongoing record. It documents direction and pace — whether growth is accelerating, flat, or declining — and serves as a foundation for forecasting, investor updates, and internal goal setting. The DOCX version is easy to edit, while the PDF works well for printing or sharing as a clean snapshot.
When Do You Need a Company Growth Chart?
A growth chart becomes valuable any time you need to show or study change over a period of time. Common scenarios include:
- Monthly performance reviews — logging revenue and expenses to see whether the business is trending up or down.
- Investor or board updates — presenting a clean, consistent record of headcount and revenue growth across quarters.
- Annual planning sessions — comparing year-over-year figures to set realistic targets for the period ahead.
- Hiring decisions — tracking how staff count has scaled relative to output or sales volume.
- Product or market expansion — measuring the impact of entering a new region or launching a new line.
- Tracking a turnaround — monitoring whether corrective actions are reversing a downward trend month by month.
Types of Growth You Can Track
Not all growth means the same thing, and a flexible chart lets you follow several dimensions at once. Financial growth covers revenue, gross profit, and recurring income. Customer growth tracks new sign-ups, active accounts, and retention. Operational growth includes headcount, locations, and production capacity. Market growth reflects share, geographic reach, or brand awareness. Choosing two or three metrics that genuinely drive your business keeps the chart focused and meaningful rather than cluttered with numbers no one reviews.
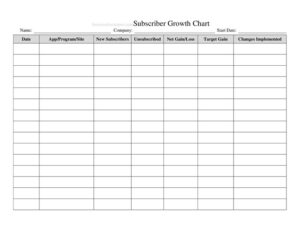
What a Company Growth Chart Should Have
An effective growth chart is built for consistency, so every entry can be compared fairly against the last. At minimum it should include:
- The company or department name and the reporting owner.
- A clear time period column — week, month, quarter, or year.
- The specific metrics being measured, each in its own labeled column.
- Actual figures recorded for each period.
- A space for targets or goals to compare against actuals.
- A change or growth-rate column showing the difference from the prior period.
- Notes for context, such as a one-off event or a seasonal swing.
Consistent units and definitions matter most: if “revenue” means net in one row and gross in another, the chart loses its value.
How to Fill Out a Company Growth Chart
- Name the chart. At the top, enter your company or division name and the overall date range the chart covers.
- Assign an owner. Note who is responsible for updating the figures so accountability is clear.
- Set your time intervals. In the first column, list each period in order — for example Jan, Feb, Mar, or Q1, Q2, Q3.
- Label your metrics. Across the top, create a column for each measure you’ll track, such as Revenue, New Customers, and Headcount.
- Record actual figures. For each period, enter the real number in the matching cell, using consistent units throughout.
- Enter targets. Where the template provides a goal column, fill in the figure you were aiming for.
- Calculate the change. In the growth column, note the increase or decrease versus the previous period, as a number or percentage.
- Add notes. Use the notes field to explain spikes, dips, or anything unusual that affected the numbers.
- Review and date. Confirm the totals, add the date completed, and save a copy for your records.
Tips for Getting Useful Insight From Your Chart
The chart is only as good as the decisions it informs. Update it on a fixed schedule — the same day each month works well — so data never becomes stale. Pull figures from the same source each time to avoid inconsistencies. Look beyond raw totals to growth rates; a smaller percentage gain on a large base can still be substantial. When a number moves sharply, write the reason in the notes immediately, while it’s fresh, so future reviews aren’t guesswork. Finally, share the chart with the people who can act on it rather than letting it sit in a folder.
How It Differs From a Financial Statement
A growth chart is not a substitute for formal financial statements. A profit-and-loss statement or balance sheet follows accounting standards and reports a complete financial picture for a defined period. A growth chart, by contrast, is a tracking and visualization tool that pulls a handful of key indicators together to show momentum over time. Use the growth chart for quick trend monitoring and goal tracking, and rely on audited or accountant-prepared statements when precision and compliance are required.
Common Mistakes to Avoid
- Changing definitions mid-chart — switching how a metric is calculated makes period comparisons meaningless.
- Tracking too many metrics — overloading the chart buries the few numbers that actually matter.
- Updating irregularly — sporadic entries create gaps that hide real trends.
- Ignoring context — recording a dip without noting why leaves future readers confused.
- Mixing units or time frames — combining monthly and quarterly data in one column distorts the picture.
- Focusing only on totals — without a growth-rate column, you miss whether progress is speeding up or slowing.
Frequently Asked Questions
What is a Company Growth Chart used for? It is used to record and compare key business metrics over time so you can see trends in revenue, customers, headcount, and other measures. Teams use it for performance reviews, planning, and investor updates. It turns scattered numbers into a single, easy-to-read record of progress.
How do I fill out a Company Growth Chart? Start by naming the chart and setting your time intervals in the first column, then label each metric you want to track across the top. Enter the actual figure for each period, add your target, and calculate the change versus the prior period. Use the notes field to explain anything unusual.
What metrics should I include? Choose two or three measures that genuinely drive your business, such as revenue, profit, new customers, or staff count. Avoid tracking everything at once, since too many columns dilute focus. The best metrics are ones you can update consistently and act on.
Is a Company Growth Chart a legal or accounting document? No, it is an internal tracking and planning tool, not a formal financial statement. For tax filings, audits, or anything requiring accounting compliance, rely on properly prepared statements. The chart is best used alongside, not in place of, those records.
How often should I update it? Most businesses update on a fixed cadence — monthly or quarterly works for many — so the data stays current and comparable. Pick a schedule and stick to it, pulling figures from the same source each time. Consistency is more useful than frequency.
How much does this template cost? Nothing — it’s a free download here in both PDF and DOCX, with no signup required. The DOCX version is fully editable so you can add or rename columns to match your metrics. Print the PDF for meetings or share it digitally as a snapshot.
This Company Growth Chart template is a general example provided for informational purposes only and does not constitute legal, financial, or tax advice. Reporting practices and requirements vary by organization and jurisdiction. Consult a qualified accountant or financial professional for guidance specific to your situation.
Related Forms
- Document Tracker
- Submission Tracker Received
- New Car Inventory Card
- Inventory Count Sheet
- Project Status Report
- Yearly Cleaning Log
Browse more in Log and Inventory.