Voting Demographics By Age
Track and report voter turnout across age groups with the free Voting Demographics By Age form, a clean template available as a free download in PDF and DOCX.
PDF
XLSX
0
likes
Download Files
- XLSX
The Voting Demographics By Age form is a simple data sheet used to record and summarize how many voters fall into each age bracket for a given election, precinct, or survey. People most often use it to break down turnout patterns so campaigns, election officials, and researchers can see which age groups are participating. It is free to download in both PDF and DOCX formats, with no signup required.
What Is a Voting Demographics By Age Form?
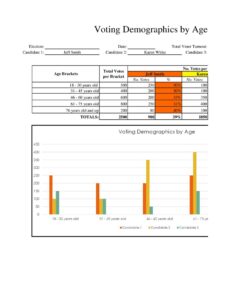
A Voting Demographics By Age form is a structured worksheet that organizes voter participation numbers according to age ranges such as 18–24, 25–34, 35–44, and so on. It is typically used by campaign staff, poll workers, civic organizations, political science researchers, and party volunteers to capture how participation is distributed across generations. Rather than tracking individual voters, the form aggregates counts into categories, making it easy to spot trends, compare precincts, and present findings clearly. The document usually pairs each age band with a vote count and a percentage, giving anyone reviewing it a quick, readable snapshot of the electorate’s age profile for a specific contest or polling location.
When Do You Need a Voting Demographics By Age Form?
This form is useful any time you need to understand or communicate participation by age. Common situations include:
- Campaign strategy meetings — when a team wants to see which age groups are turning out and where to focus outreach or advertising.
- Post-election analysis — when a precinct or county summarizes turnout to compare against previous cycles.
- Academic and civic research — when a student, professor, or nonprofit studies generational voting behavior.
- Get-out-the-vote planning — when volunteers identify under-represented age brackets to target with reminders.
- Board or committee reporting — when an organization presents demographic findings to leadership or members.
- Grant and funding applications — when a civic group must document the communities and age segments it serves.
What a Voting Demographics By Age Form Should Have
A complete and trustworthy version of this form should clearly identify the data set it represents and present numbers in a consistent, readable layout. At minimum it should include a title and a description of the election or survey, the date, and the location or precinct covered. The core of the document is a table that lists defined age ranges alongside the number of voters in each band, the percentage of the total each band represents, and a final total row. A well-built form also notes the data source so readers know whether numbers came from official rolls, exit surveys, or estimates. Adding the name of the person who compiled the data and the date prepared improves accountability and makes the report easy to verify later.
How to Fill Out a Voting Demographics By Age Form
Because this is a flexible reporting template, fill it in step by step:
- Add the title and context. At the top, name the election, survey, or report and note the jurisdiction or precinct it covers.
- Record the date and location. Enter the election date or data collection date and the polling place, district, or region.
- Define your age brackets. List the age ranges you will track, such as 18–24, 25–34, 35–44, 45–54, 55–64, and 65+.
- Enter the vote count per bracket. Next to each age range, write the number of voters recorded in that group.
- Calculate percentages. Divide each bracket’s count by the grand total and multiply by 100 to fill in the percentage column.
- Total the figures. Sum all counts and confirm the percentages add up to roughly 100 percent.
- Note the source and preparer. Record where the data came from and who compiled it, with the date prepared.
- Review for accuracy. Double-check that every bracket has a value and that the totals reconcile.
Choosing Age Brackets That Tell a Clear Story
The usefulness of this form depends heavily on how you group the ages. Standard ten-year bands (18–24, 25–34, and upward) make it easy to compare your numbers against published national or state figures, which often use the same ranges. If you are studying a specific question — say, youth turnout — you might use narrower bands at the lower end, such as 18–21 and 22–24, while keeping wider bands for older voters. Whatever scheme you choose, apply it consistently across every report so comparisons over time stay valid. Avoid overlapping ranges like 18–25 and 25–34, which double-count anyone who is 25 and muddy your totals.
Turning Raw Counts Into Useful Insight
Once the table is complete, the percentages do most of the storytelling. A bracket that holds 40 percent of the total electorate but only 15 percent of those who voted signals a participation gap worth addressing. Comparing the same brackets across two elections reveals whether outreach is working. Many users add a short summary paragraph beneath the table highlighting the highest and lowest turnout groups and any notable shifts. Keeping the underlying source data on file lets you defend the numbers if anyone questions them, and presenting the figures as both raw counts and percentages gives readers context that a single number cannot provide on its own.
Common Mistakes to Avoid
- Overlapping age ranges that cause some voters to be counted in two brackets and inflate your total.
- Mismatched totals where the sum of brackets does not equal the reported grand total.
- Percentages that don’t add to 100 due to rounding errors or a missed category.
- Omitting the data source, which makes the report impossible to verify or reproduce.
- Leaving out the date or location, so the numbers can’t be tied to a specific election.
- Mixing data from different elections in one table without labeling each clearly.
Frequently Asked Questions
What is a Voting Demographics By Age form used for? It is used to summarize how voter turnout or participation is distributed across age groups for a given election, precinct, or survey. Campaigns, election offices, and researchers rely on it to spot trends and guide outreach. The form turns scattered counts into a clear, comparable table.
Is this form free to download? Yes. You can download the Voting Demographics By Age template for free in both PDF and DOCX formats, with no account or signup required. The DOCX version is fully editable so you can adjust the age brackets and columns to match your needs.
What age brackets should I use? Standard ten-year ranges such as 18–24, 25–34, 35–44, 45–54, 55–64, and 65+ work well and match many published statistics. You can narrow or widen the bands depending on your research question, but keep them consistent and non-overlapping across every report.
Where do I get the data to fill it in? Sources include official voter files or election results released by your local election authority, exit surveys, or your own canvassing records. Always note the source on the form so others can understand and verify how the numbers were gathered.
Is this an official government document? No. This is a general-purpose reporting template, not an official ballot or government record. Election authorities may have their own required reporting formats, so check local rules if you are submitting demographic data officially.
Can I customize the columns and layout? Absolutely. The DOCX template lets you add columns for previous-cycle comparisons, change the age ranges, or include a summary section. Customize it freely to fit the election, survey, or presentation you are preparing.
This template is a general example provided for informational purposes only and does not constitute legal, statistical, or professional advice. Election reporting requirements and data-privacy rules vary by jurisdiction, so consult your local election authority or a qualified professional before relying on this form for official purposes.
Related Forms
- Contributor Mailing List
- Campaign Funding Violation Complaint Letter
- Opponent Information Form
- Candidate Favorability
- Voting Demographics By Gender
- Voting Demographics By Income
Browse more in Political.